A few years ago I used to work with an obsessive statistician who continuously tracked seasonality stats in equities. They were rather detailed and proved to be very useful in the context of my regular discretionary trading activities. I was wondering if any of you have produced pertinent worksheets or templates you wouldn't mind sharing. Otherwise any pointers or insights would be appreciated. I'm attaching links to a few example graphs to give you an idea of what I'm looking for. Apologies for the full links below but for some reason I'm unable to properly link images in this editor.
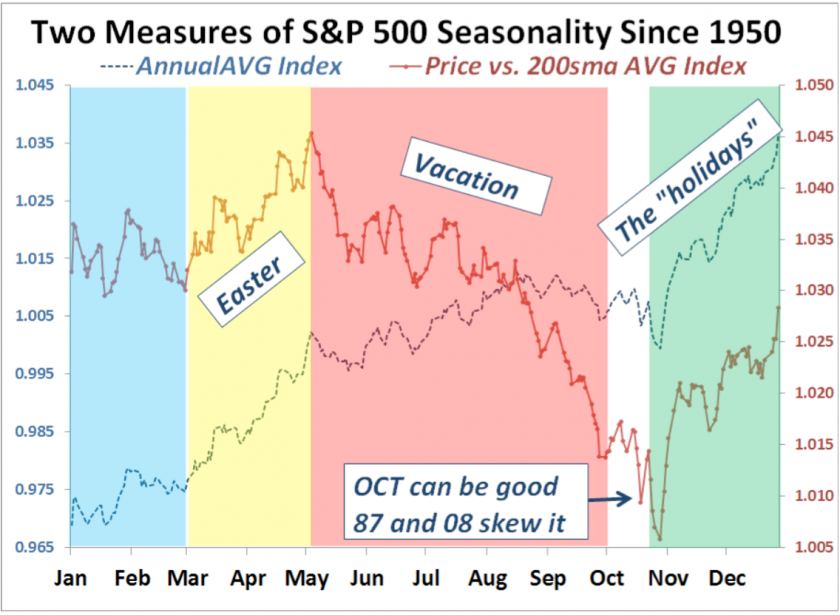
http://evilspeculator.com/wp-content/uploads/2017/06/sp500_avgindex_minus200sma-840x615.png
http://evilspeculator.com/wp-content/uploads/2017/06/sp500_percent_positive_months-840x749.png>
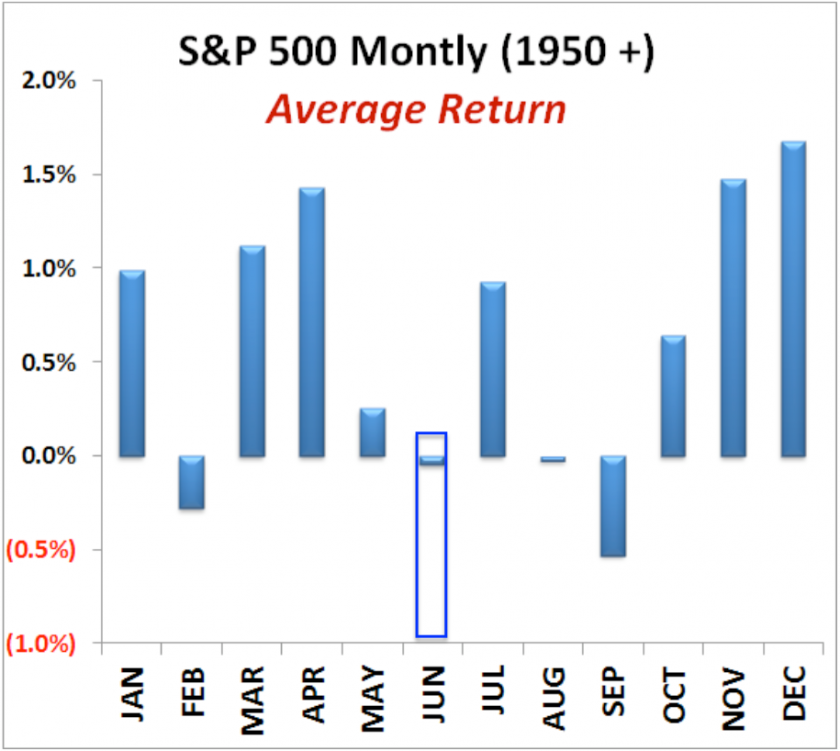
http://evilspeculator.com/wp-content/uploads/2017/06/June_average_return-840x751.png
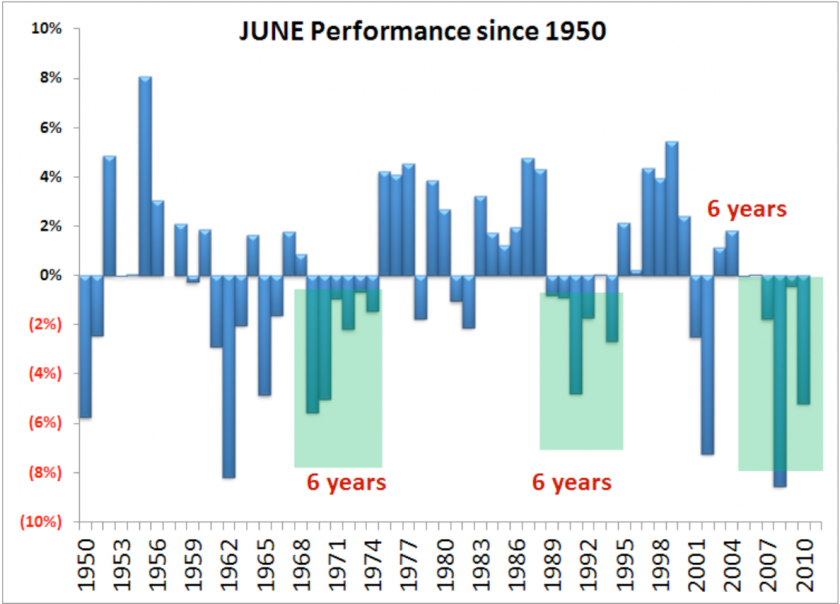
http://evilspeculator.com/wp-content/uploads/2017/06/sp500_june_performance-840x604.png
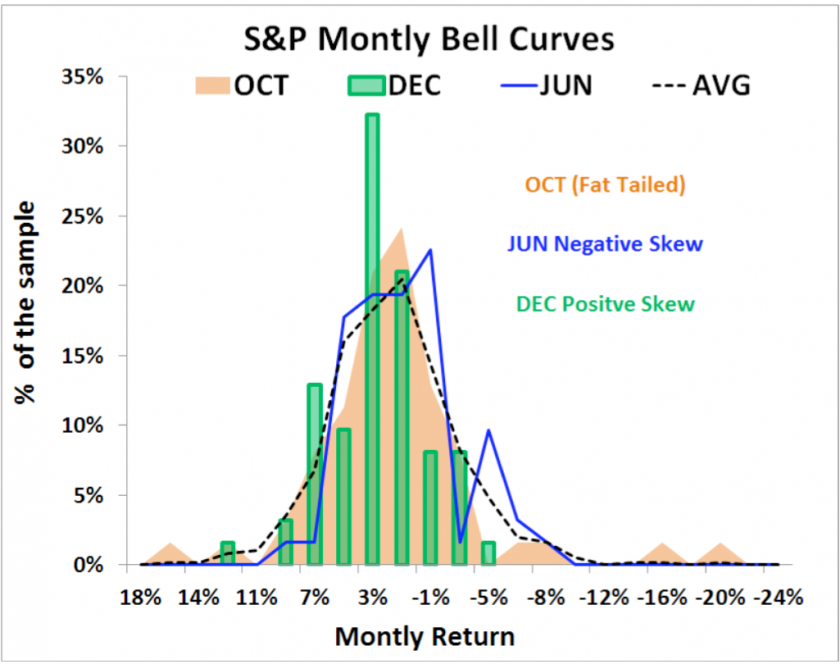
http://evilspeculator.com/wp-content/uploads/2017/06/sp500_monthly_bell_curves-840x664.png
http://evilspeculator.com/wp-content/uploads/2017/06/sp500_quantiles-840x611.png
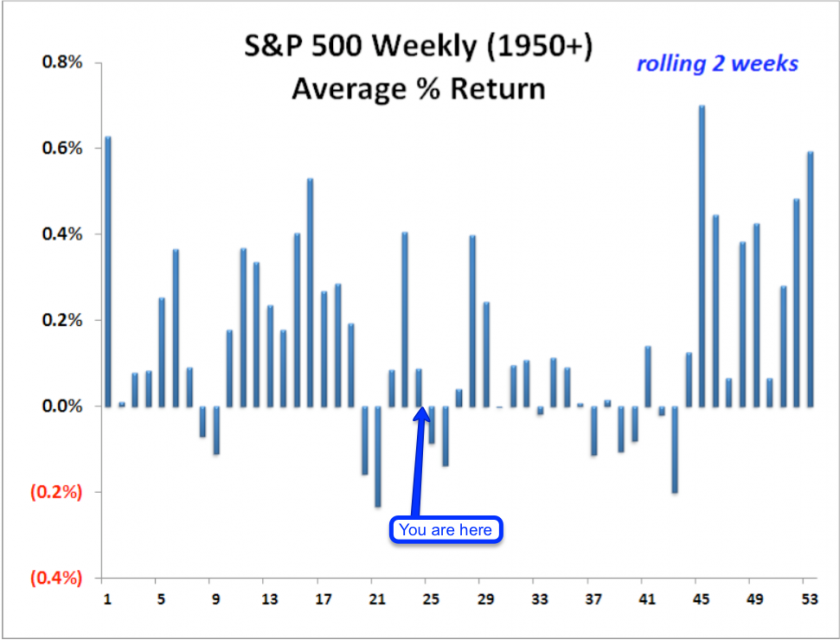
http://evilspeculator.com/wp-content/uploads/2017/06/sp500_weekly_average_return-840x640.png
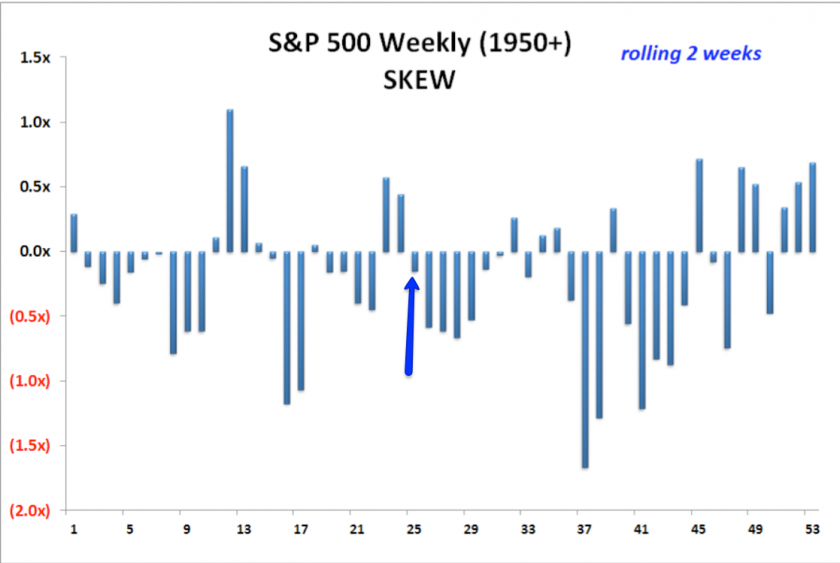
http://evilspeculator.com/wp-content/uploads/2017/06/sp500_skew_weekly-840x563.png
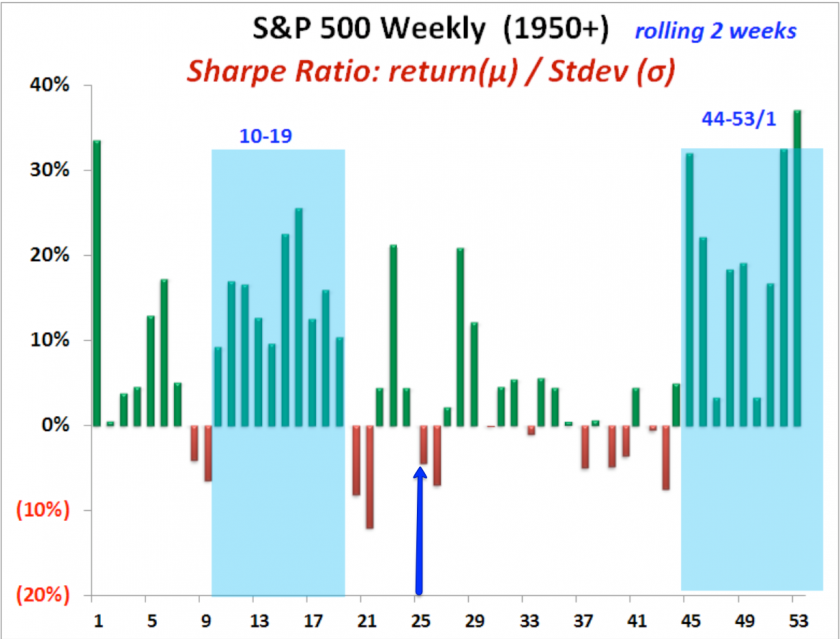
http://evilspeculator.com/wp-content/uploads/2017/06/sp500_sharpe_ratio-840x639.png