Hi,
I'm planning to research on TPO profiles and I'm evaluating the feasibility of conducting such research on Quantopian (particularly on the futures)
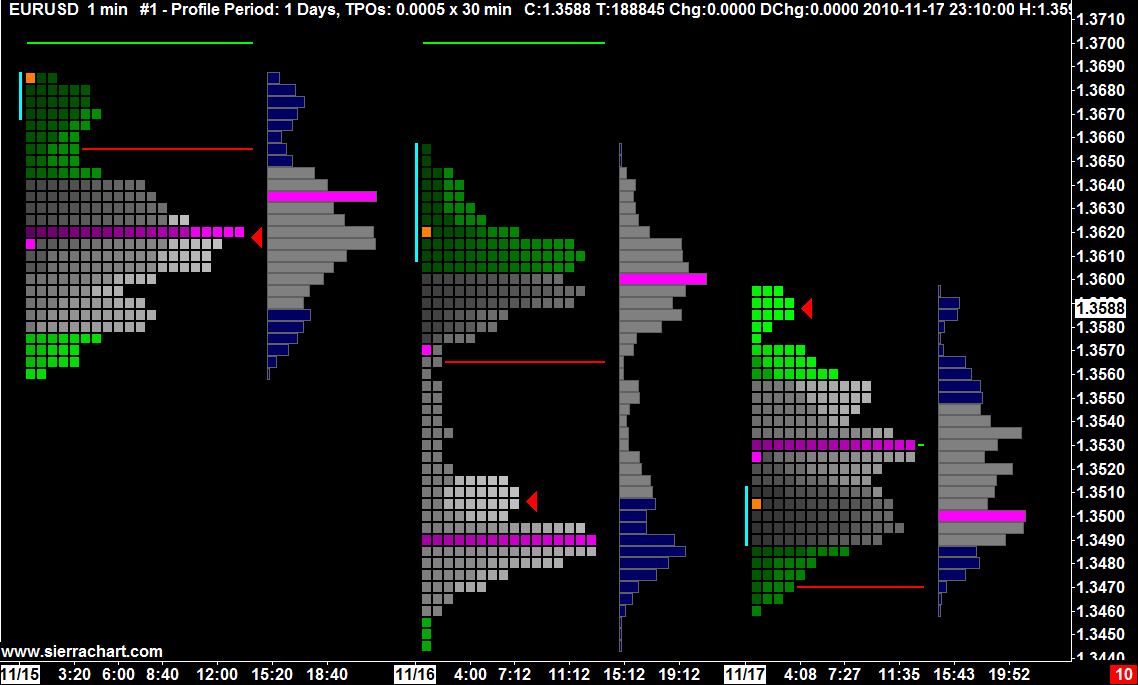
Time Price Opportunity or TPO Chart, shows the price distribution during the specified time, thus forming a profile. This allows you to understand at which levels or ranges the price has spent the most time, as well as to determine the main support and resistance levels.
For those who are not familiar TPO charts look like this
A good resource to look into is SierraChart website
TPO requires Tick Data information to calculate the most amount of time price has spent around a specific range.
Here are some of my questions:
- Has anyone done anything like this before?
- Is there anyway to get access to TickData on Quantopian?
- Any suggestion to what factors to consider for the research ?
I'm planning to calculate TPO support and resistance and their shapes (b-shape, p-shape or normalised) , run a PCA and build a basic regression model and validate their usefulness.
Feedbacks are welcome.
Thanks