Quantopian's community platform is shutting down. Please read this post for more information and download your code.
Back to Community
Comparing OLPS algorithms (OLMAR, UP, et. al.) on ETFs

I compared most of the OnLine Portfolio Selection (OLPS) algorithms to determine if any of them are decidedly better at enhancing a rebalanced passive strategy of ETFs. Online Portfolio Selection: A Survey by Bin Li and Steven C. H. Hoi provides the most comprehensive review of multi-period portfolio allocation optimization algorithms. The authors developed the OLPS Toolbox, but I use Mojmir Vinkler's implementation and extend his comparison to a more recent timeline with a set of ETFs to avoid survivorship bias and idiosyncratic risk (as suggested by Ernie Chan).

Vinkler does all the hard work in his thesis, and concludes that Universal Portfolios work practically the same as Constant Rebalanced Portfolios (CRP), and work better for an uncorrelated set of small and volatile stocks.

My goal was to find if any strategy is applicable to a set of ETFs. I perform this comparison outside of the Research Notebooks because the code is standalone and there is no easy way to add a package to the Research section. I conclude that in practice it's hard to say that any of these algorithms decidedly beat BAH (Buy and Hold) or CRP (Constant Rebalanced Portfolio).

It was interesting to see the Kelly strategy blow up so many times, and that OLMAR is really not outperforming. Let me know if the methodology needs improving or if you see any errors and have different conclusions. Thx.

Sample run, one of the more optimistic ones
(Sample run, one of the more optimistic ones)

39 responses

Wow! Lots of work! What is BCRP? I'm curious why it might perform best on the market sectors?

BCRP = Best Constant Rebalanced Portfolio constructed with hindsight and introduced by Tom Carver in his Universal Portfolio (UP) papers as a benchmark, much in the same way as the UP's are compared to the "best stock in hindsight" . It's an interesting property of UP's that they can beat the best stock (recall the talk by Prof. Michael Kearns). BCRP is no really tradable, so it's an interesting property where it lands more than anything else.

I like how the ONS paper put it: "A CRP strategy rebalances the wealth each trading period to have a fixed proportion in every stock in the portfolio. We measure the performance of an online investment strategy by its regret, which is the relative difference between the logarithmic growth ratio it achieves over the entire trading period, and that achieved by a prescient investor — one who knows all the market outcomes in advance, but who is constrained to use a CRP. An investment strategy is said to be universal if it achieves sublinear regret."

And the paper notes (not its main conclusion): "The simple strategy of maintaining a uniform constant-rebalanced portfolio seems to outperform all previous algorithms. This rather surprising fact has been observed by Borodin et al. (2004) also."

I'm thinking CRP is looking good enough and the focus could be more on asset selection rather than asset allocation. Thoughts?

Thanks Paul,

So, do you have a specific objective in mind? You say "My goal was to find if any strategy is applicable to a set of ETFs" and my read is that you are trying to develop a long-only approach that gains a bit on SPY, but has kinda the same diversification as SPY?

Specifically regarding the OLMAR algorithm and the sector ETFs, I've played around with it, and my read so far is that it won't work. Why? Probably because each ETF is too correlated with the market on a minute-by-minute basis. You'd need an industry sector to gyrate over days/weeks, falling below its N-day mean and then reverting, so that the algo could buy low and eventually rotate out of the sector, selling high. But economically, the industries are all wired together under the hood, and so you are just dealing with an arbitrarily coarsely chopped SPY (i.e. you could chop it up some other way, and get the same result). With an individual security, there can be less correlation to the market, greater volatility relative to SPY, and short-term events that drive the price away from its N-day mean, to which it might subsequently revert.

Grant, at first I was just comparing all the algorithms to get a feel for how they behave, but then focused on the following questions:
- Does OLMAR add value over CRP on a Lazy Portfolio (a benchmark I use) ?
- Does any other OLPS algo consistently beat OLMAR or CRP?
- Are any of the other OLPS algorithms worth implementing on Q?

My new conclusion is that OLMAR does add value to a Lazy Portfolio if tested or run over a long enough period of time. This gives OLMAR a chance to grab onto a period of volatility. But in an up market (2013-1014) you want to Follow-the-Leader, not Follow-the-Looser. Of the other algo's, maybe it's worth understanding what ONS is doing.

I've revised the the OLPS Comparison Notebook with the following changes:
- CRP now takes on the Swensen allocation to differentiate it from UCRP and provide a more realistic comparison
- SPY/TLT portfolio now has a 70/30 allocation
- Added CRP comparison to the OLMAR starting in 2010

Vinkler fixed the RMR (Robust Mean Reversion) algorithm and I have now added it to the notebook and see that in this scenario RMR beats OLMAR in the case of high volatility (check the updated image in the first post), but otherwise they are close to the same. Interesting!

Paul,

This is really interesting and I didn't know about universal-portfolios which is something we should definitely try to add to Quantopian.

I agree with Grant, however. Using a few ETFs, while avoid survivor-ship bias, might introduce many other biases. Grant mentioned the correlation but I also think the small number of assets (ETFs) you're using might reduce the effectiveness of some weighting algorithms.

Ideally we'd run this over a larger universe on the Quantopian data which is survivor-ship bias free. After adding universal-portfolios running your NB on research should be pretty straight-forward.

Another question I have is on your plots about the weights: Shouldn't those always sum to one?

Disclaimer

The material on this website is provided for informational purposes only and does not constitute an offer to sell, a solicitation to buy, or a recommendation or endorsement for any security or strategy, nor does it constitute an offer to provide investment advisory services by Quantopian. In addition, the material offers no opinion with respect to the suitability of any security or specific investment. No information contained herein should be regarded as a suggestion to engage in or refrain from any investment-related course of action as none of Quantopian nor any of its affiliates is undertaking to provide investment advice, act as an adviser to any plan or entity subject to the Employee Retirement Income Security Act of 1974, as amended, individual retirement account or individual retirement annuity, or give advice in a fiduciary capacity with respect to the materials presented herein. If you are an individual retirement or other investor, contact your financial advisor or other fiduciary unrelated to Quantopian about whether any given investment idea, strategy, product or service described herein may be appropriate for your circumstances. All investments involve risk, including loss of principal. Quantopian makes no guarantees as to the accuracy or completeness of the views expressed in the website. The views are subject to change, and may have become unreliable for various reasons, including changes in market conditions or economic circumstances.

plot_decomposition plots the log returns or returns of each asset. The weights are viewed in the bright colored bars under the plot ( best_olmar.plot(weights=True, ) and those are as a fraction of one.

I'm using the universal-portfolios package to understand these algorithms better, but the goal would be to identify the better ones and implement them directly in Q or Zipline to see if the results still hold. I think Q has a more detailed backtester (better cost and slippage model) and a means to deploy to live trading.

I ran a longer test of Grant's OLMAR algorithm. Although in certain period of time, OLMAR can under perform the S&P 500 benchmark by as large as 20%, in the long run OLMAR does significantly outperform the S&P 500. I think this result is consistent with the argument of universal portfolio that a smart way of choosing weight online will outperform the best individual in the popular "in the long run", but there is certainly no guarantee that any online portfolio selection algorithm can outperform a lazy portfolio algorithm in any period of time.

Of course, if there is a way to detect "regime shift", and you can use "follow the winner" strategy in bull market and use "follow the loser" strategy in normal or bear market, the performance would certainly be better. But if there is an algorithm to detect when is "bull market" and when is "bear market", the algorithm itself would make a lot of money.

Peter,

Wow! Not too shabby. Glad you gave it a try.

Grant

Playing around with Peter's OLMAR algorithm, it only seems to work with the seed money of $100k. If I input any smaller amount of money the algorithm loses it in just a couple months to a years time. I don't understand why the logic would completely break down with smaller pots of money? A balanced portfolio should be able to be balanced at nearly any value.

Not sure what's going on. Keep in mind that if your capital gets too small, a problem could result. For example, $10K over 20 stocks is an average of only $500 per stock. The number of shares to be allocated for each is an integer, so there's a digitization effect too (e.g. the ideal number would be 1.7, but I can only chose 1 or 2--I'm guessing that Quantopian rounds down).

Also, if there is lots of trading, commissions will come into play, at the $1 per trade level. You might try turning off commissions to see if it has an effect at lower capital levels.

Grant

Quick question for the experts of the forum.
For the below experiment, I was wondering how to print the weights of the individual portfolios in a number format.
So there would be a list of stocks with there weighting next to it.

http://nbviewer.ipython.org/github/paulperry/quant/blob/master/OLPS_Comparison.ipynb#Comparing-OLPS-algorithms-on-a-diversified-set-of-ETFs

Many thanks all,
Best Regards,
Andrew

After an algo run you get returned an AlgoResult object. If you call the weights property on that object you will get a Pandas DateTimeIndex'ed DataFrame with all the weights for every date of the run.

Hi Paul!
Thank you!
But I am still having trouble.
My attempt is below.

r=algos.UP.Weights()
print r

Is comes up with error.
Many thanks in advance for your help.
Regards,
Andrew

It's a @property , so you need to remove the parenthesis , and make it lower case:
r=algos.UP.weights .

Hi Paul!
cheers for your help!
I have changed my code to the following -

r=algos.UP.weights
print r

However I am still struggling to print out the weights from the above algorithm.
How do you print out the pandas data frame.
I have tried goggling but cannot connect the dots.

Many thanks in advance
Regards,
Andrew

It should have worked, but maybe your Python is Version 3 , in which case use print(r), or just r in an ipython (or Jupyter) notebook:

r=algos.UP.weights  
r  

Hi Paul,
when I type in -
r=algos.UP.weights
print(r)

the result in the ipython notebook is
"unbound method UP.weights"

So it just prints out what it is, not the actual matrix.
I am not sure how to get the pandas data frame to show.

Many thanks in advance.
Andrew

You'll have to provide more code to solve this problem. Here is an example that works for me:

from pandas.io.data import DataReader  
from datetime import datetime  
from universal import algos  
spy_tlt_data = DataReader(['SPY', 'TLT'], 'yahoo', start=datetime(2010,1,1))['Adj Close']  
spy_tlt_olmar_2010 = algos.OLMAR().run(spy_tlt_data)  
spy_tlt_olmar_2010.weights.ix['2010']

Hi Paul!
Cheers for the code!
Yer that works.
Just have one question however when I run the code with differenet algorithms in most days,
it comes up as having the entire portfolio invested in a single instrument and it just rotates throughout
the different instruments.
Does this seem like the correct logic?

Many thanks for the comments,
Andrew

2010-02-25 1.000000 0.000000 0.000000 0.000000 0.000000 0.000000
2010-02-26 1.000000 0.000000 0.000000 0.000000 0.000000 0.000000
2010-03-01 0.000000 0.000000 0.000000 0.000000 0.000000 1.000000
2010-03-02 0.000000 0.000000 1.000000 0.000000 0.000000 0.000000
2010-03-03 0.000000 0.000000 1.000000 0.000000 0.000000 0.000000
2010-03-04 0.000000 0.000000 0.000000 1.000000 0.000000 0.000000
2010-03-05 0.000000 0.000000 1.000000 0.000000 0.000000 0.000000
2010-03-08 0.000000 0.000000 0.000000 1.000000 0.000000 0.000000
2010-03-09 0.000000 0.000000 0.000000 1.000000 0.000000 0.000000
2010-03-10 0.000000 0.000000 0.000000 1.000000 0.000000 0.000000
2010-03-11 0.000000 0.000000 0.000000 1.000000 0.000000 0.000000
2010-03-12 0.000000 0.000000 1.000000 0.000000 0.000000 0.000000
2010-03-15 1.000000 0.000000 0.000000 0.000000 0.000000 0.000000
2010-03-16 1.000000 0.000000 0.000000 0.000000 0.000000 0.000000
2010-03-17 0.000000 0.000000 1.000000 0.000000 0.000000 0.000000
2010-03-18 0.000000 0.000000 1.000000 0.000000 0.000000 0.000000
2010-03-19 0.000000 0.000000 1.000000 0.000000 0.000000 0.000000
2010-03-22 1.000000 0.000000 0.000000 0.000000 0.000000 0.000000
2010-03-23 1.000000 0.000000 0.000000 0.000000 0.000000 0.000000
2010-03-24 0.000000 0.000000 0.000000 1.000000 0.000000 0.000000
2010-03-25 0.000000 0.000000 0.000000 1.000000 0.000000 0.000000
2010-03-26 0.000000 0.000000 0.000000 1.000000 0.000000 0.000000
2010-03-29 0.000000 0.000000 0.000000 1.000000 0.000000 0.000000
2010-03-30 0.000000 0.000000 0.000000 1.000000 0.000000 0.000000

Just chiming in. I published an algorithm that gives dual guarantees to the best combination in hindsight and to any benchmark.
http://papers.nips.cc/paper/5436-exploiting-easy-data-in-online-optimization

It works in several settings and the guarantees hold in several different settings. I've wanted to try it inside of this exact type of comparison scenario, but haven't had the time. If anyone wants to collaborate, get in contact with me.

Essentially, you can run any of the other algorithms as a benchmark and only pay a constant cost to never perform worse than the benchmark or alternative algorithm. If you run the B algorithm on a benchmark algorithm and the A algorithm on a set of alternative algorithms, you then get the advantage of guarantees to the best mixture over the A algorithms and single B algorithm.

@Andrew, yes the algorithms are quite radical if the eps is high, and in my case they are set to 10 or 5. Try a lower eps and you will see that at least OLMAR will start to make fractional allocations to the assets. I hope this helps, Paul.

This fine code/thread generates optimism so it may be healthy to test, an alternative point of view ...

"does significantly outperform the S&P 500"

Careful! If we are talking about the code, that depends on how returns are calculated, as you will see. By the route based on amount of money actually utilized, if margin is in play, returns by that method will be proportionally lower. Since conceivably real money could be at stake, and lives (although surely no one would just toss that onto IB), do avoid heartache, always account for any margin. Currently I believe if you clone and run that, the numbers are as below:

(IDE returns show 190.1% at the end of the backtest currently)
output  = ending stocks value + cash = .portfolio_value = ~290k  
input   = maximum cash utilized = 183476 (~83k negative cash)  
profit  = output - input = 290050 - 183476 = 106574  
returns = profit / input = 106574 / 183476  
returns = .58 or 58% (less than half of benchmark, which is 128%)  

[edit: corrected numbers above] Result: Less than half of the benchmark

Notice the mysterious inconsistency 3.5 months after the algo above was posted, only 190% overall compared to 700%. Why? Appreciate anyone who would clone/run and verify or negate this. In the first year the portfolio approaches minus 40 (-40% vs -21% shown in the original) so that's quick to check into. Data changed? Different stocks returned by get_fundamentals? Or did I do something wrong? Please check it. Thanks.

A few comments:

I, too, have been testing Grant's OLMAR algorithm. The thing I like most about it is that it is ...as Nassim Taleb would say, “anti-fragile” or "convex." Antifragility is a convex response to a stressor, leading to a positive sensitivity to volatility. In plain English, the market crashes but your strategy makes money. Simple graphic explanation of convexity at:

http://imgur.com/rRb7c23

In the backtest I posted, look at the returns between the peak and trough of the Oct 2007 - Mar 2009 market crash - while simply letting the algo chug along with only SPY and IEF to choose from. While the broad market dropped 53% during that period, OLMAR made 20.6%. That’s convex.

To trade this live, make one decision: If IEF is outperforming TLT, trade SPY against IEF, and vice versa. As a bonus, the drawdowns for OLMAR are sufficiently comfortable to even use SSO in place of SPY.

Frankly, Grant, your OLMAR code is, overall, the best performing code I’ve found since joining this community. The backtest I've attached is your work; I just gave the algo SPY and IEF to work with and used Interactive Brokers' low per share commission. IB's fees are low enough and this performance is good enough ...to make the daily trading frequency moot. In every one of my tests, the fees are far less than the average financial advisor charges.

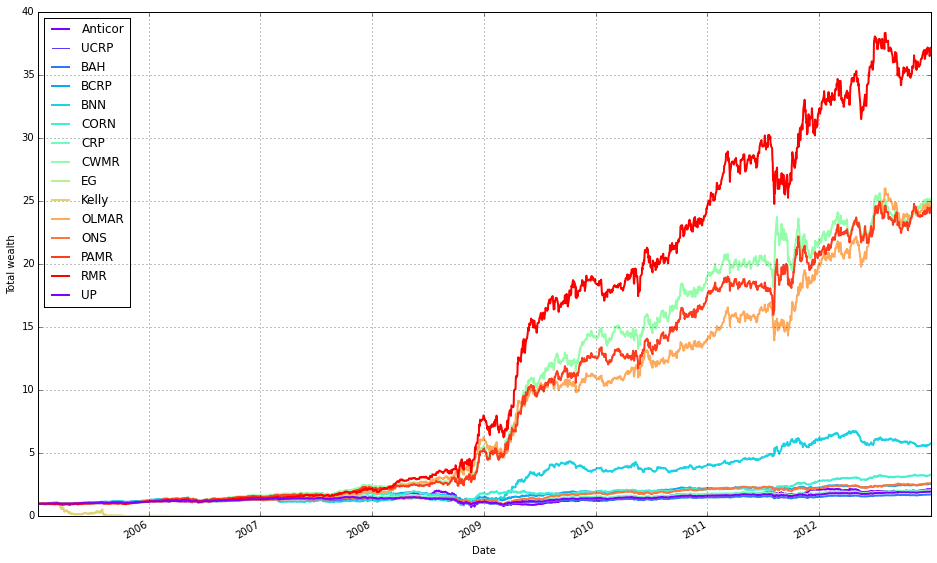
Paul, what a great comparison. Nice work. One caveat: although RMR appears the clear winner in your graphical comparison, RMR severely underperforms OLMAR during a crash. Using the same peak-trough dates for the S&P crash and just giving RMR - SPY and IEF - to work with, RMR produces a 17% loss compared with OLMAR’s 20% gain. Nothing, repeat nothing, makes it easier to adhere to a strategy than a minimal drawdown.

I've also tested OLMAR using a "motif" or "thematic" investing approach. Take for example this situation: hackers start hacking everybody (Sony, JPM, etc.) - you identify the top five cybersecurity stocks and turn over the trading to OLMAR. From August 2014 to August 2015, OLMAR doubles the returns for what motifinvesting.com/ has posted for their cybersecurity "motif" product. This algo is robust, especially if you fundamentally believe that Kelly investing is a superior strategy.

Sincerest gratitude to both of you - Grant and Paul - for both your intellectual gifts ...and for so willingly sharing such precious work.

ADDENDUM

Wondering what OLMAR means in real life …real money terms? Look at the strategy’s ROI, year by year, from 2008 to the end of 2014.

Table: SPX vs OLMAR

So if you invest $100K, you could safely draw $25,000 per year from the strategy. Practically speaking, you live trade OLMAR on IB and set up an automated electronic (ACH) transfer to your checking account. Each month you transfer $25K/12 months. Modify the withdrawal or the investment to suit your risk budget.

Here are some brief definitions for the strategies Paul has compared:

Robust Median Reversion (RMR): exploits the reversion phenomenon by robust L1-median estimator.

Constant Rebalanced Portfolios (CRP): follows Kelly’s idea of keeping a fixed fraction for each asset on all periods.

The best possible CRP strategy in hindsight is often known as Best Constant Rebalanced Portfolios (BCRP), which is the optimal strategy if the market is i.i.d. (marked by noise which is independent and identically distributed (against time)).

The Universal Portfolios (UP): describes a portfolio whose historical performance is the weighted average of all CRPs.

Exponential Gradient (EG) strategy: maximizes the expected log portfolio return estimated by last price relatives, and minimizes the deviation from last portfolio.

Anti-correlation (Anticor): bets on the consistency of positive lagged cross-correlation and negative auto-correlation.

Passive Aggressive Mean Reversion (PAMR): iteratively chooses portfolio minimizing the expected return based on last price relatives.

Confidence Weighted Mean Reversion (CWMR): exploits the mean reversion property and the variance information of portfolio.

@Stephen, I've been backtesting your latest code with Minute resolution and am getting very erratic results. Is this expected?

@JS regarding the algo by SH, MD
Try this (second line):

def rebalance_portfolio(context, data, desired_port):  
    if get_open_orders(): return  

Adding that line in a run from the beginning of 2014 to now in minute mode, this holds its own against the benchmark.
Pretty decent, isn't it now. Low beta, low drawdown, ok return.

Gathering a little more information

The leverage of 2 (rounded by the custom chart) reflects the margin (borrowing, negative cash) shown in the cash_low value ~$117k.
Ending portfolio value: $114,783
Starting point: $100,000
Added during the run: $116,935
Input total: $216,935 (money transferred into the IB account to achieve this result)
Ending result: $114,783
Effective return: Edit: I'm going to leave this to someone smarter than myself to figure out, for now. It ^sure looks like a loss^ and yet 100 grand can't just evaporate overnight (around 2014-01-21).
Anyway, the key point: Watch out for margin unless on purpose

@Jacob No, not expected.
@Gary Wow, killer point ...but I'm not totally clear regarding your statement "...leverage of 2 (rounded by the custom chart)." Margin isn't a true loss, just money that can't be put to work, right? You've definitely hit on a key backtesting issue, which it would seem to me all algorithms should take into account.

Also, would you kindly share the source code that both fixes the minute resolution issue and adds the leverage plot?

So does margin simply kill this gorgeous strategy? Tell me it isn't so! (Grant, you out there?)

You can read a clarification by fawce on leverage and margin.
Leverage over 1 is margin, borrowing, it is being put to work however unfortunately not accounted for by the backtester chart and metrics, invisible unless we shine a light on it.
So then as you requested here's your code I was working with, note the custom chart, didn't plan to share it so it's rough (prints every minute on last day) however my additions are noted. Also, you said "all algorithms should take into account" bingo! You got it.

Gary, read through the thread you referenced above. Wow, that is an eye-opener. Leads me to distrust much of what I've been looking at. I had earlier written Alisa asking if there was a way to export the "Transaction Details" of the backtest so I could crunch the numbers ...just sensing the Cumulative Return Plots weren't telling the entire story. The Q interface makes it so easy to not take margin into account. Major re-think needed. Man.

I am utterly amazed that we are all ...so blindly trusting ...of something so important ...and yet which is so critically flawed. For anyone planning to put skin in the game, that is, bet real money on their algo, Gary's point about margin could not be more salient.

Having trouble switching batch_transform to history() in the code I posted above. There are statistics and np things I don’t understand.

Could anyone lend a hand? Think it's a just cause.

Stephen, I took a stab at porting the code to use history() instead of batch_transform. In addition to changing to get_history() I also vectorized the x_tilde computation which makes things a bit more readable and fixed the other problem you were seeing.

Wow, Thomas, I am so grateful.

A great algorithm just got better. Really appreciate your help.

Truly folks, how many algorithms can gain 21% when the market crashes 53%? This thing is "antifragile" (Nassim Taleb) ...i.e. robust to shocks.

You're very welcome.

Time to start paper-trading this :).

Back again with more minute-trading sadness. I ran Thomas's code with minute resolution, and while there's no descriptive error for the exception I'm getting, it appears to crash when total returns are around -2,000,000%.

Jacob, did you use schedule_function() to only do the rebalancing ever so often (e.g. daily)? Minutely might be overkill, especially accounting for transaction costs.

Hi Thomas,

I modified the code so that all of the handle_data code is scheduled to run daily. Is there something about my choice of scheduling parameters that caused such a performance hit?

Thomas...can you pleased ellaborate on your bias against Minute trading this strategy? It is a brilliant piece of work, but I am curious if you could run this in minute (or later on, seconds) mode. It seems like it could do well either way, but given that transaction costs to be minimized with volume, the returns may be slightly lower but your risk would be much lower because you are in and out..ideas?

It's certainly possible that it works well. Stocks seem to be mean-reverting in the short-term but have momentum in the longer-term. Since OLMAR is a mean-reversion strategy you could try it. In fact, in research it should be pretty straight-forward to test the algorithm on various frequencies.