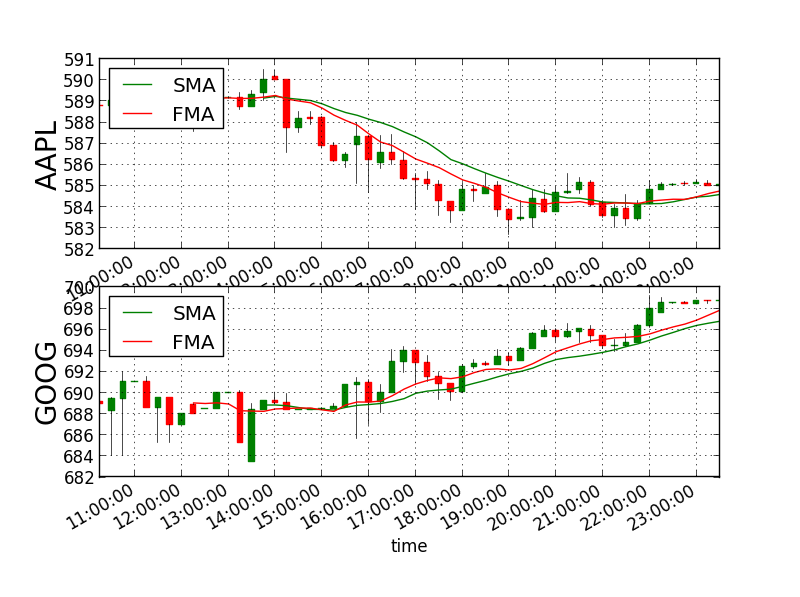
I'm surprised no one built out a candlestick algorithm. For those who aren't familiar with candlesticks, it's a bit of a hokey analysis that looks at patterns between the open, close, high and low price of a stock at some arbitrary time interval to determine whether the stock is likely to go up or down during the next period.
In my opinion, its popularity comes from the fact that the analysis is subjective enough to claim a kind of accuracy that is difficult to challenge empirically. Also, it produces pretty graphs.
I replicated candle stick analysis in the algorithm below. I boiled down the patterns to 4 factors.
1. Whether the stock ended higher or lower at end of day
2. Relative size of the high wick
3. How big the body is
4. Relative size of the low wick
The patterns I used for matching are the patterns indicated in the website below. The algorithm is setup in such a way that these patterns can easily be changed or new patterns added.
http://www.swing-trade-stocks.com/candlestick-patterns.html
The inputs required, apart from the patterns you're looking to match, is what you consider a big or small body and wick size. I was thinking about putting in some relative measure (5% movement in a day is large?) but chose to keep it simple with an absolute value instead.
Obviously the results are less than impressive but if someone really believes in candle stick analysis, that person can easily build on this. Also, this can pretty easily be expanded to analyze candles and trade multiple stocks.
Does anyone know of a way to plot candlesticks on a graph as an addendum to the graph produced?