Wow - now, I love Futures Mag, but that Excel spreadsheet is wrong on yet another level :(. Look at the calc for the each band, it is taking the standard deviation of the close data AND the SMA !?! For example, on F64 and G64, it should be .... STDDEV(C44:C64), not C44:D64. The latter makes no sense, to add the SMA into the statistics, and is probably just an unfortunate typo.
I don't think you did that though - you did put what the trade2win's esiotrot said, which I guess i just disagree with.
[ Oh, I wonder if that C44:D64 typo essentially does the same thing in the end as esiotrot in essence - maybe so. ]
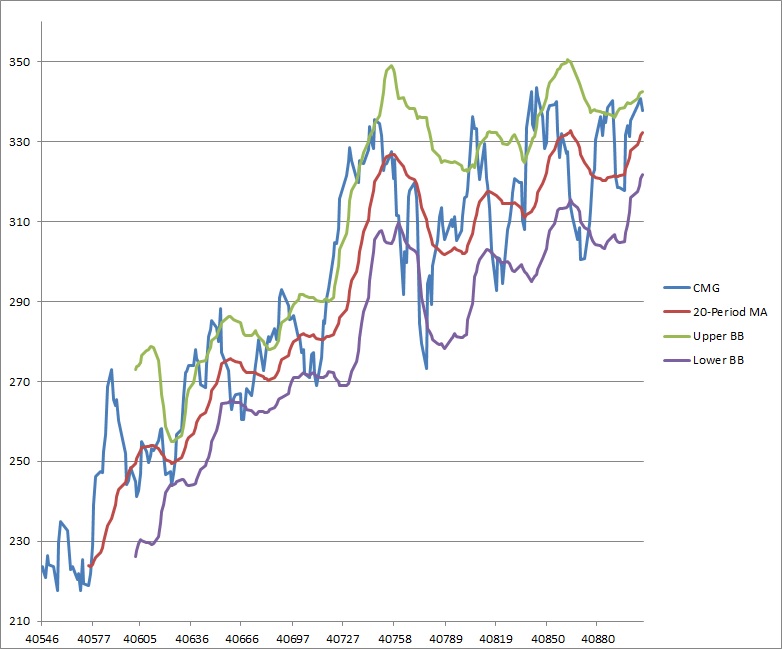
The stddev function already subtracts out the average of the dataset for each point, so we don't need to do that again. Otherwise, you're subtracting out the average twice which will result in a less volatile bands. See how much smoother yours are than in the URL chart I posted.
So, I'd recommend:
....
df['MA20']=pandas.stats.moments.rolling_mean(df['price'], 20)
df['STDDEV']=pandas.stats.moments.rolling_std(df['price'], 20)
df['UPPER_BB']=df['MA20']+2*df['STDDEV']
df['LOWER_BB']=df['MA20']-2*df['STDDEV']
....
Like I said, compare in yahoo finance or whatever commercial package to be sure. Something like that is probably the best independent source to validate. I'm happy to be incorrect and learn too :).
Nice use of the new fetch tool!
With regards, and thanks,
Ken
EDIT: PS, see http://www.bollingeronbollingerbands.com/support/?s=ovindi in the top portion.
However, in some more searching I have seen many "formulations", even on with the std dev of the SMA.
So, I agree there's a lot of muddle out there. Hopefully this clears it up in this case.
